Property | 28 October 2024

Coutts London Prime Property Index Q3 2024: Prices drop and buyers get bigger discounts

Our latest research on luxury London property shows prices falling, average discounts close to 9% and almost 80% of sales coming in below asking price.

KEY STATS

8.6%

Average discount negotiated by buyers

79%

Percentage of properties sold at a discount to asking price


2.3%

Drop in prices compared to the previous quarter

We’re seeing improving conditions for high-end property buyers in London with asking prices dropping and good discounts negotiated.

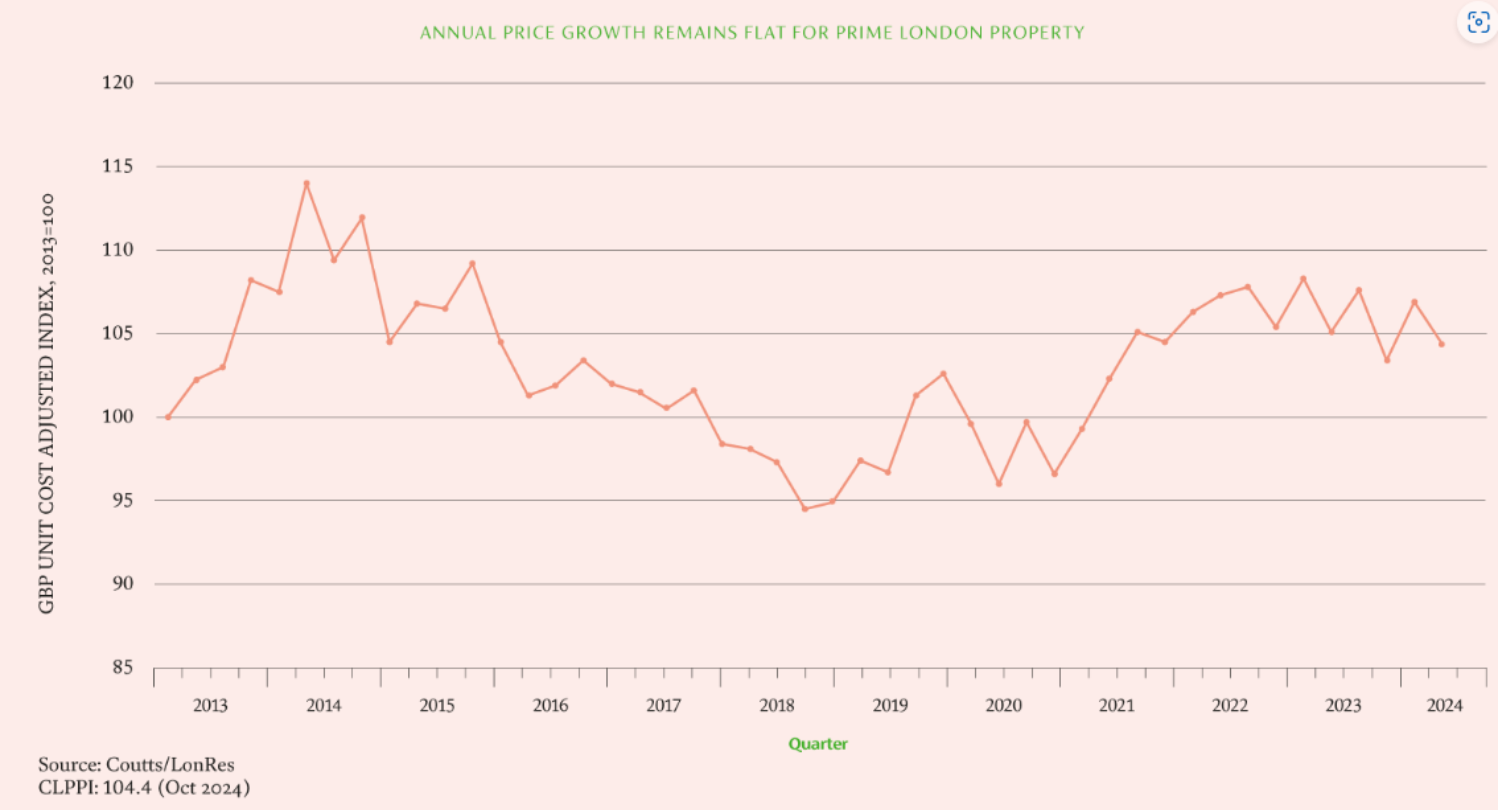
Prices of homes worth £1 million or more in the capital are down 2.3% from July to September this year. Average discounts, meanwhile, rose to 8.6% – up from 7.7% the previous quarter – and 79% of sales were below asking price.

These were just some of the key findings from the latest Coutts London Prime Property Index, which analyses the city’s prime property market area-by-area. 
clppi-Q3-2024-graph

Sales rise as mortgage market improves

Katherine O’Shea, Coutts Real Estate Director, said sales were up too.

“Sales volumes for the third quarter of this year have risen 7.2% compared to the previous three months – April to June. And interestingly, sales volumes are also up 14% on the 10-year average,” she said.

“This demonstrates the resilience of the prime London property market. It’s mainly activity in the £2 million to £5 million price bracket that’s driving this growth.”

Katherine added that the mortgage market was “slowly improving” for house buyers which was likely to help boost sales further.

She said: “The direction of travel is clear – interest rates are coming down. The big questions are – how quickly will they drop and by how much?”

The Bank of England cut interest rates by 0.25% in August, to 5%. This was the first UK cut since 2020. The market currently expects rates to come closer to 3.5% this time next year, but as always, that could change.

Those who rely on public listings could

miss out

New prime properties put up for sale fell 14% compared to the previous quarter, but Katherine said that was pretty normal for the time of year.

“The volume of new properties coming onto the market over the summer tends to drop anyway,” she said. “Also, it’s worth noting that, on average, across prime London the volume of properties available on the open market is up 8% annually, which is more good news for buyers.”

But she added it can be extremely challenging trying to find “best-in-class” property if merely relying on public listings.

“Clients and agents are telling us that the very best of properties are sold privately or pre-marketed to buying agents, which means a lot of unrepresented buyers could miss out on opportunities,” she said.

Local Insights

Good deals in central London

Prime property in some central London postcodes is selling at very low prices compared to historic levels. Price growth has been pretty limited over the past decade. As Katherine explains: “The market peaked in 2014 and has struggled to reach those levels ever since.”

For example:

  • prices in Knightsbridge & Belgravia are still 23.1% below the height of the market, following price falls of 5.6% in the last quarter
  • prices in Mayfair & St James’s are still 23.7% below the height of the market, following price falls of 4.9% in the last quarter
  • prices in South Kensington are still 15.7% below the height of the market, despite 1.2% growth in the last quarter


Price corrections in outer London after ‘Covid bounce’

Areas a little further afield have seen meaningful price drops in recent months.

For example:

  • prices in Hampstead & Highgate peaked in Q2 2023 and have since fallen 17% – in the last year prices are down 9.6%
  • prices in Wimbledon, Richmond, Putney & Barnes peaked in Q4 2023 and have since fallen 12.5% – in the last quarter alone we’ve seen prices drop 7.3%


But this comes after these areas saw significant price rises during the Covid pandemic as demand for more space and bigger gardens soared.

Pockets of strong activity

Transaction volumes are up across the capital, but we’re seeing particularly strong activity in some areas.

For example:

  • in Bayswater & Maida Vale sales volumes are up 58.7% since the last quarter, 52.1% annually and 33.2% compared to the 10-year average
  • in St John’s Wood, Regent’s Park & Primrose Hill sales volumes are up 50% quarter-on-quarter, 50% annually and 31.4% compared to the 10-year average
  • in Kensington, Notting Hill & Holland Park sales volumes are up 8.5% compared to last quarter, 21.4% annually and 14.9% compared to the 10-year average

Considering your next move? Let Coutts help

Our real estate team could help you find the perfect property. And our bespoke mortgage service means we could provide a mortgage that’s as unique as you are.

Or contact your private banker to find out how we could help you.

Your home or property may be repossessed if you do not keep up repayments on your mortgage. Changes in the exchange rate may increase the sterling equivalent of your debt (multi-currency debt only).

Over-18s only. Terms and conditions apply. You may not be eligible for all Coutts mortgage solutions. Security may be required. Product fees may apply.

Pick a postcode: Area-by-area breakdown

  • Battersea, Clapham & Wandsworth

    Prime property prices here increased 2.9% in the last quarter meaning prices are now just 0.1% below the peak.

    -7.5%

    Annual sales volume growth

    -4.9%

    Average Discount

    5.8%

    Annual gross rental yield

    Q3 2024
     
    Sold Property Price band Quarterly Average Sales £/Sq Ft Annual Change in price Time on market before sale (days) % of sold stock reduced in price Average discount for sold stock Quarterly Sales Volumes Annual change in quarterly sales volumes
    <£1m £811 4.3% 160 38.3% -4.8% 154 -1.9%
    £1m - £10m £952 4.6% 162 36.7% -4.9% 49 -7.5%
    £10m+ - - - - - - -
    Source: lonres
  • Bayswater & Maida Vale

    83% of all property here is sold at a discount to asking price, with buyers on average negotiating 10.6% off the asking price.

    52.1%

    Annual sales volume growth

    -10.6%

    Average Discount

    4.3%

    Annual gross rental yield

    Q3 2024
     
    Sold Property Price band Quarterly Average Sales £/Sq Ft Annual Change in price Time on market before sale (days) % of sold stock reduced in price Average discount for sold stock Quarterly Sales Volumes Annual change in quarterly sales volumes
    <£1m £1.096 8.8% 160 55.7% -6.9% 61 7.0%
    £1m - £10m £1,374 -2.2% 154 58.9% -10.6% 73 52.1%
    £10m+ £3,067 60.2% 274 100.0% -18.8% 2 200.0%
    Source: lonres
  • Chelsea

    92% of properties here are sold at a discount to asking price, with buyers on average negotiating 11.3% off the asking price.

    1.1%

    Annual sales volume growth

    -11.3%

    Average Discount

    4.0%

    Annual gross rental yield

    Q3 2024
     
    Sold Property Price band Quarterly Average Sales £/Sq Ft Annual Change in price Time on market before sale (days) % of sold stock reduced in price Average discount for sold stock Quarterly Sales Volumes Annual change in quarterly sales volumes
    <£1m £1.340 11.9% 184 62.0% -10.7% 50 -5.7%
    £1m - £10m £1,697 0.4% 156 47.9% -11.3% 94 1.1%
    £10m+ £2,647 -7.5% 80 33.3% -8.3% 3 50.0%
    Source: lonres
  • Fulham & Earl’s Court

    Property prices here have stayed pretty flat over the last year and are still 10.8% below the height of the market.

    14.7%

    Annual sales volume growth

    -7.5%

    Average Discount

    5.2%

    Annual gross rental yield

    Q3 2024
     
    Sold Property Price band Quarterly Average Sales £/Sq Ft Annual Change in price Time on market before sale (days) % of sold stock reduced in price Average discount for sold stock Quarterly Sales Volumes Annual change in quarterly sales volumes
    <£1m £903 -7.3% 163 60.9% -7.9% 87 8.8%
    £1m - £10m £1,098 0.3% 138 37.2% -7.5% 78 14.7%
    £10m+ - - - - - - -
    Source: lonres
  • Hammersmith & Chiswick

    Property is selling fastest in this area – 128 days on average, which is a month faster than the average across prime London.

    -31.7%

    Annual sales volume growth

    -4.8%

    Average Discount

    4.7%

    Annual gross rental yield

    Q3 2024
     
    Sold Property Price band Quarterly Average Sales £/Sq Ft Annual Change in price Time on market before sale (days) % of sold stock reduced in price Average discount for sold stock Quarterly Sales Volumes Annual change in quarterly sales volumes
    <£1m £816 -5.6% 188 35.9% -6.3% 39 11.4%
    £1m - £10m £999 4.8% 126 42.9% -4.8% 28 -31.7%
    £10m+ - - - - - - -
    Source: lonres
  • Hampstead & Highgate

    Following significant growth post-Covid, prices in this area peaked in Q2 2023. There have been meaningful price corrections across Hampstead & Highgate since then and prices are now 17% below the height of the market. In the last year prices fell 9.6%.

    31.0%

    Annual sales volume growth

    -5.8%

    Average Discount

    4.4%

    Annual gross rental yield

    Q3 2024
     
    Sold Property Price band Quarterly Average Sales £/Sq Ft Annual Change in price Time on market before sale (days) % of sold stock reduced in price Average discount for sold stock Quarterly Sales Volumes Annual change in quarterly sales volumes
    <£1m £908 -0.9% 188 37.8% -4.3% 37 54.2%
    £1m - £10m £1,138 -8.4% 180 36.4% -5.8% 55 31.0%
    £10m+ - - - 100.0% - 1 0.0%-
    Source: lonres
  • Kensington, Notting Hill & Holland Park

    Sales activity here is strong with transaction volumes up 8.5% quarter-on-quarter, 21.4% annually and 14.9% compared to the 10-year average.

    21.4%

    Annual sales volume growth

    -7.8%

    Average Discount

    4.1%

    Annual gross rental yield

    Q3 2024
     
    Sold Property Price band Quarterly Average Sales £/Sq Ft Annual Change in price Time on market before sale (days) % of sold stock reduced in price Average discount for sold stock Quarterly Sales Volumes Annual change in quarterly sales volumes
    <£1m £1,066 6.7% 209 54.1% -8.5% 61 27.1%
    £1m - £10m £1,490 6.1% 139 39.2% -7.8% 102 21.4%
    £10m+ - - 220 0.0% - 5 -17.0%
    Source: lonres
  • King’s Cross & Islington

    Transaction volumes in this area have been extremely slow so far this year. Prime transaction volumes are down 75% compared to a year ago.

    -75.0%

    Annual sales volume growth

    -5.2%

    Average Discount

    5.2%

    Annual gross rental yield

    Q3 2024
     
    Sold Property Price band Quarterly Average Sales £/Sq Ft Annual Change in price Time on market before sale (days) % of sold stock reduced in price Average discount for sold stock Quarterly Sales Volumes Annual change in quarterly sales volumes
    <£1m £904 -6.9% 157 30.8% -2.8% 26 -21.2%
    £1m - £10m £1,206 12.6% 183 28.6% -5.2% 7 -75.0%
    £10m+ - - - - - - -
    Source: lonres
  • Knightsbridge & Belgravia

    Following price falls of 5.6% in the last quarter, prices are still 23.1% below the height of the market, offering buyers incredible value for money when compared to historic prices.

    -2.5%

    Annual sales volume growth

    -11.8%

    Average Discount

    3.7%

    Annual gross rental yield

    Q3 2024
     
    Sold Property Price band Quarterly Average Sales £/Sq Ft Annual Change in price Time on market before sale (days) % of sold stock reduced in price Average discount for sold stock Quarterly Sales Volumes Annual change in quarterly sales volumes
    <£1m - - 229 60.0% - 5 -16.7%
    £1m - £10m £1,822 -7.0% 162 64.1% -11.8% 39 -2.5%
    £10m+ £3,401 24.2% 170 40.0% - 5 -
    Source: lonres
  • Marylebone, Fitzrovia & Soho

    New listings here are down 9.4%, and property for sale on the open market is down 2.7% compared to a year ago.

    -6.9%

    Annual sales volume growth

    -9.9%

    Average Discount

    4.6%

    Annual gross rental yield

    Q3 2024
     
    Sold Property Price band Quarterly Average Sales £/Sq Ft Annual Change in price Time on market before sale (days) % of sold stock reduced in price Average discount for sold stock Quarterly Sales Volumes Annual change in quarterly sales volumes
    <£1m £1,144 -8.5% 185 58.3% -8.7% 36 -2.7%
    £1m - £10m £1,657 3.0% 167 46.3% -9.9% 54 -6.9%
    £10m+ - - - - - 0 100.0%
    Source: lonres
  • Mayfair & St James’s

    Prices here fell 4.9% in the last quarter meaning prices now are still 23.7% below the height of the market. Buyers here are also negotiating the biggest discounts, 13.8% on average.

    -11.1%

    Annual sales volume growth

    -13.8%

    Average Discount

    3.0%

    Annual gross rental yield

    Q3 2024
     
    Sold Property Price band Quarterly Average Sales £/Sq Ft Annual Change in price Time on market before sale (days) % of sold stock reduced in price Average discount for sold stock Quarterly Sales Volumes Annual change in quarterly sales volumes
    <£1m £1,165 -23.8% - 0.0% -7.0% 1 -66.7%
    £1m - £10m £1,860 -20.7% 159 40.0% -13.8% 20 11.1%
    £10m+ - - 204 0.0% - 4 0.0%
    Source: lonres
  • Pimlico, Westminster & Victoria

    New instructions are up 31% and the volume of stock available on the open market is up 25% annually – good news for buyers in this area.

    -5.9%

    Annual sales volume growth

    -6.3%

    Average Discount

    4.9%

    Annual gross rental yield

    Q3 2024
     
    Sold Property Price band Quarterly Average Sales £/Sq Ft Annual Change in price Time on market before sale (days) % of sold stock reduced in price Average discount for sold stock Quarterly Sales Volumes Annual change in quarterly sales volumes
    <£1m £1,052 -5.2% 186 52.0% -7.9% 50 -12.3%
    £1m - £10m £1,281 1.8% 171 43.8% -6.3% 32 -5.9%
    £10m+ - - - - - - -
    Source: lonres
  • South Kensington

    MFS New listings here are down 9.4%, and property for sale on the open market is down 2.7% compared to a year ago.

    10.8%

    Annual sales volume growth

    -10.8%

    Average Discount

    4.0%

    Annual gross rental yield

    Q3 2024
     
    Sold Property Price band Quarterly Average Sales £/Sq Ft Annual Change in price Time on market before sale (days) % of sold stock reduced in price Average discount for sold stock Quarterly Sales Volumes Annual change in quarterly sales volumes
    <£1m £1,327 2.5% 189 41.2% -9.1% 17 41.7%
    £1m - £10m £1,672 0.5% 189 48.8% -10.8% 41 10.8%
    £10m+ - - - - - 0 -100.0%.
    Source: lonres
  • St John’s Wood, Regent’s Park & Primrose Hill

    Six super prime properties (worth £10 million or more) were sold here in the last quarter, making it the most active market for super prime activity.

    50.0%

    Annual sales volume growth

    -8.8%

    Average Discount

    4.8%

    Annual gross rental yield

    Q3 2024
     
    Sold Property Price band Quarterly Average Sales £/Sq Ft Annual Change in price Time on market before sale (days) % of sold stock reduced in price Average discount for sold stock Quarterly Sales Volumes Annual change in quarterly sales volumes
    <£1m £939 -4.5% 166 43.1% -5.7% 51 30.8%
    £1m - £10m £1,455 1.9% 142 42.9% -8.8% 63 50.0%
    £10m+ £3,207 30.2% 66 33.3% -16.3 6 500.0%
    Source: lonres
  • Wimbledon, Richmond, Putney & Barnes

    Following significant growth post-Covid, prices in this area peaked at the end of last year. There have been some price corrections here since then and prices are now 12.5% below the height of the market. In the last quarter we’ve seen prices fall 7.3%.

    -2.6%

    Annual sales volume growth

    -3.9%

    Average Discount

    4.9%

    Annual gross rental yield

    Q3 2024
     
    Sold Property Price band Quarterly Average Sales £/Sq Ft Annual Change in price Time on market before sale (days) % of sold stock reduced in price Average discount for sold stock Quarterly Sales Volumes Annual change in quarterly sales volumes
    <£1m £775 7.7% 159 35.6% -3.7% 87 19.2%
    £1m - £10m £861 -2.2% 137 18.4% -3.9% 38 -2.6%
    £10m+ - - - - - 0 -
    Source: lonres

Share

More insights